Welcome to Deep Thought! At ideas42, our work involves tackling some of our world’s toughest problems. Naturally, when we need a little downtime, we unwind by solving some of the internet’s toughest puzzles.
In the spirit of a few of our core values—generosity, playfulness, and perhaps even tenacity—we’re excited to share puzzles so that you too can get one step closer to correctly answering the ultimate questions (hint: it won’t always be 42), while also (hopefully) having a bit of fun.
Puzzle
During World War 2, the US military was faced with the following problem:
They didn’t want their planes to get shot down by enemy fighters, so they need to armor them. But armor makes the plane heavier, and heavier planes are less maneuverable and use more fuel. Armoring the planes too much is a problem; armoring the planes too little is a problem. Somewhere in between there’s an optimum, and they know the optimum in terms of armor weight.
So the military went to one of the best groups of mathematicians (the Statistical Research Group) to figure out what to do and they went with some data they thought might be useful. When American planes came back from engagements over Europe, they were covered in bullet holes. But the damage wasn’t uniformly distributed across the aircraft. There were more bullet holes in the fuselage, not so many in the engines.
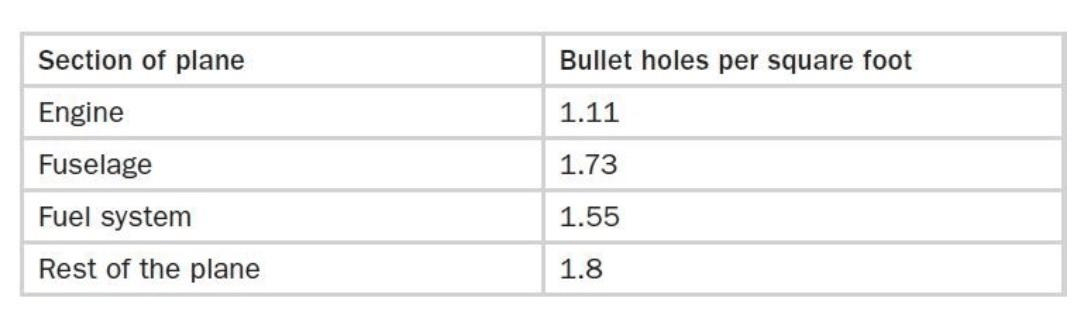
The officers saw an opportunity for efficiency; you can get the same protection with less armor if you concentrate the armor on the places with the greatest need, where the planes are getting hit the most. But exactly how much more armor belonged on those parts of the plane? If you had to decide how to distribute that optimal weight/amount of total armor amongst the parts of the plane, how would you do it (and more importantly, why?)
Think you have the answer? Submit your answer here.
To submit your own Deep Thought weekly puzzle, contact us at deepthought@ideas42.org
Solution to previous puzzle
Previous puzzle:
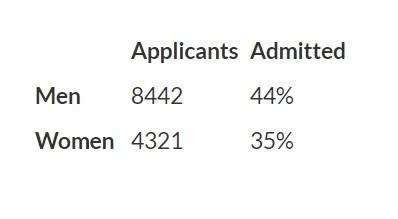
In 1973, UC Berkeley was wary of being sued for gender discrimination. The evidence against them seemed pretty bad – only 35% of female students who applied were admitted, while 44% of male applicants were admitted.
To get a better understanding of which departments were contributing to this gender discrimination, they took a deeper dive into the data behind each department’s admission rates. Once they looked at each subset contributing to the aggregate data that got them into trouble in the first place, they saw a different story. Out of the six departments, four accepted more women than men. In actuality, the gender bias was in the women’s favor.
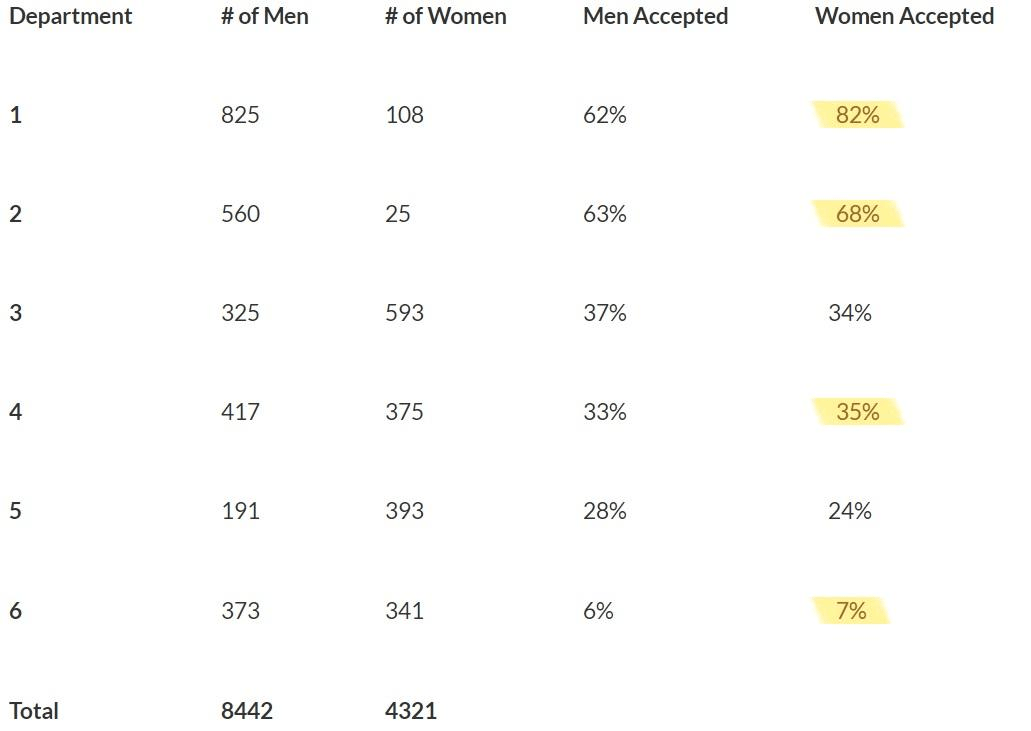
So, why did the aggregated data and the categorical data tell a completely different story? There is a confounding variable that is hidden from sight when you look at the data – can you spot it?
Solution:
This is an illustration of Simpson’s paradox– a statistical phenomenon in which a trend appears in several different groups of data but disappears or reverses when these groups are combined.
A research paper on this particular instance of the paradox in Berkeley concluded that women tended to apply to competitive departments with low rates of admission even among qualified applicants (such as in the English Department), whereas men tended to apply to less-competitive departments with high rates of admission among the qualified applicants (such as in engineering and chemistry).
Congratulations to the winners:
Christopher Foss; New York City, NY
Spencer DeRoos; Philadelphia, PA
